2023 July-December
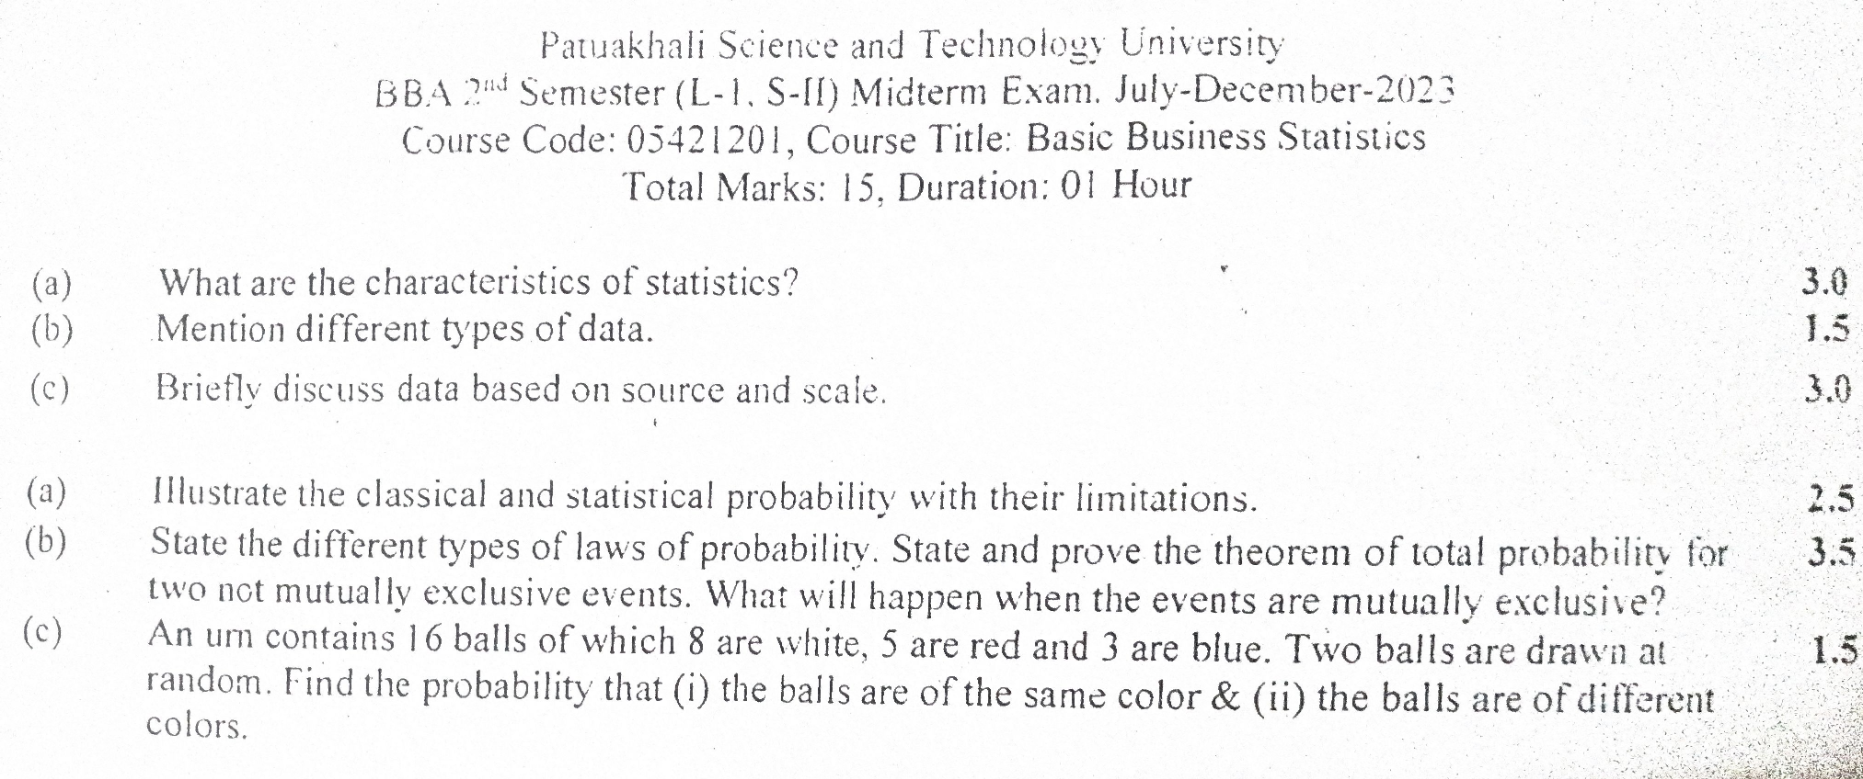
Question 1 (a): What are the characteristics of statistics?
To be considered statistics, information must possess several key features:
- Aggregates of Individuals: Statistics must deal with groups rather than isolated cases.
- Numerical Expression: Data must be presented in the form of numerical figures.
- Multiplicity of Causes: Statistical outcomes are generally influenced by various factors.
- Standard of Accuracy: The data collected must meet reasonable accuracy standards.
- Pre-determined Purpose: Collection should be driven by a specific, previously decided objective.
- Comparability: The data must allow for meaningful comparison with other datasets.
Question 1 (b): Mention different types of data.
Data is classified based on five primary criteria:
- By Source: Primary data and Secondary data.
- By Research Type: Survey data and Experimental data.
- By Measurement: Qualitative data and Quantitative data.
- By Time: Cross-sectional data, Time series data, Pooled cross sections, and Panel (Longitudinal) data.
- By Scale: Nominal data, Ordinal data, Interval data, and Ratio data.
Question 1 (c): Briefly discuss data based on source and scale.
Data Based on Source:
- Primary Data: These are original in character and generated through large-scale surveys, such as a population census, conducted by government or research bodies.
- Secondary Data: These refer to data not originally collected by the current researcher but obtained from existing published or unpublished sources, like reports from the Bangladesh Bureau of Statistics (B.B.S.).
Data Based on Scale:
- Nominal Scale: Numbers serve only as labels or tags for identifying and classifying objects, with no mathematical properties (e.g., ID numbers).
- Ordinal Scale: Used when categories have a natural ordered relationship (e.g., grading systems like A, B, C) where the distance between categories cannot be quantified.
- Interval Scale: A scale where the distance between categories is constant and known, making differences meaningful, though ratios are not (e.g., years like 2005 to 2006).
- Ratio Scale: The highest level of measurement where ratios, distances, and ordering are all mathematically meaningful (e.g., GDP growth percentages).
Question 2 (a): Illustrate the classical and statistical probability with their limitations.
1. Mathematical (Classical) Definition: If a trial results in
- Limitations: It cannot be applied if the outcomes are not equally likely or if the total number of outcomes is infinite.
2. Statistical (Empirical) Definition: If an event A occurs
- Limitations: In practice, it is difficult to repeat trials under identical conditions, and it is hard to obtain an exact numerical probability using this method.
Question 2 (b): State the different types of laws of probability. State and prove the theorem of total probability for two not mutually exclusive events. What will happen when the events are mutually exclusive?
Types of Laws: The two primary laws are the Additive Law (Theorem of Total Probability) and the Multiplicative Law (Theorem of Compound Probability).
Theorem of Total Probability (Additive Law): The probability of at least one of two not mutually exclusive events occurring is the sum of their individual probabilities minus the probability of their joint occurrence: $$P(A_1 + A_2) = P(A_1) + P(A_2) - P(A_1 A_2)$$
Proof:
- Consider a Venn diagram where
and overlap. - The area of
is the sum of the part unique to ( ) and the overlap ( ). So, (Eq. i). - Similarly, the area of
is (Eq. ii). - The total area covered by both events (
) consists of three non-overlapping parts: (Eq. iii). - Adding (Eq. i) and (Eq. ii) gives:
. - This sum includes the overlap (
) twice. By substituting (Eq. iii) into this equation, we get: . - Rearranging the terms yields: **
**.
Mutually Exclusive Case: If events are mutually exclusive, they cannot occur simultaneously, meaning
Question 2 (c): Urn Probability Problem.
Problem: 16 balls (8 White, 5 Red, 3 Blue). Draw 2 balls.
Step 1: Calculate Total Outcomes (
Step 2: Calculate Favorable Outcomes for Same Color (
- Two White (
): - Two Red (
): - Two Blue (
): Total favorable outcomes ( ) = .
Step 3: Solve for (i) Same Color: $$P(\text{Same Color}) = \frac{m}{n} = \mathbf{\frac{41}{120} \approx 0.3417}$$
Step 4: Solve for (ii) Different Colors: This is the complement of drawing the same color. $$P(\text{Different Colors}) = 1 - P(\text{Same Color}) = 1 - \frac{41}{120} = \mathbf{\frac{79}{120} \approx 0.6583}$$