2024 July-December
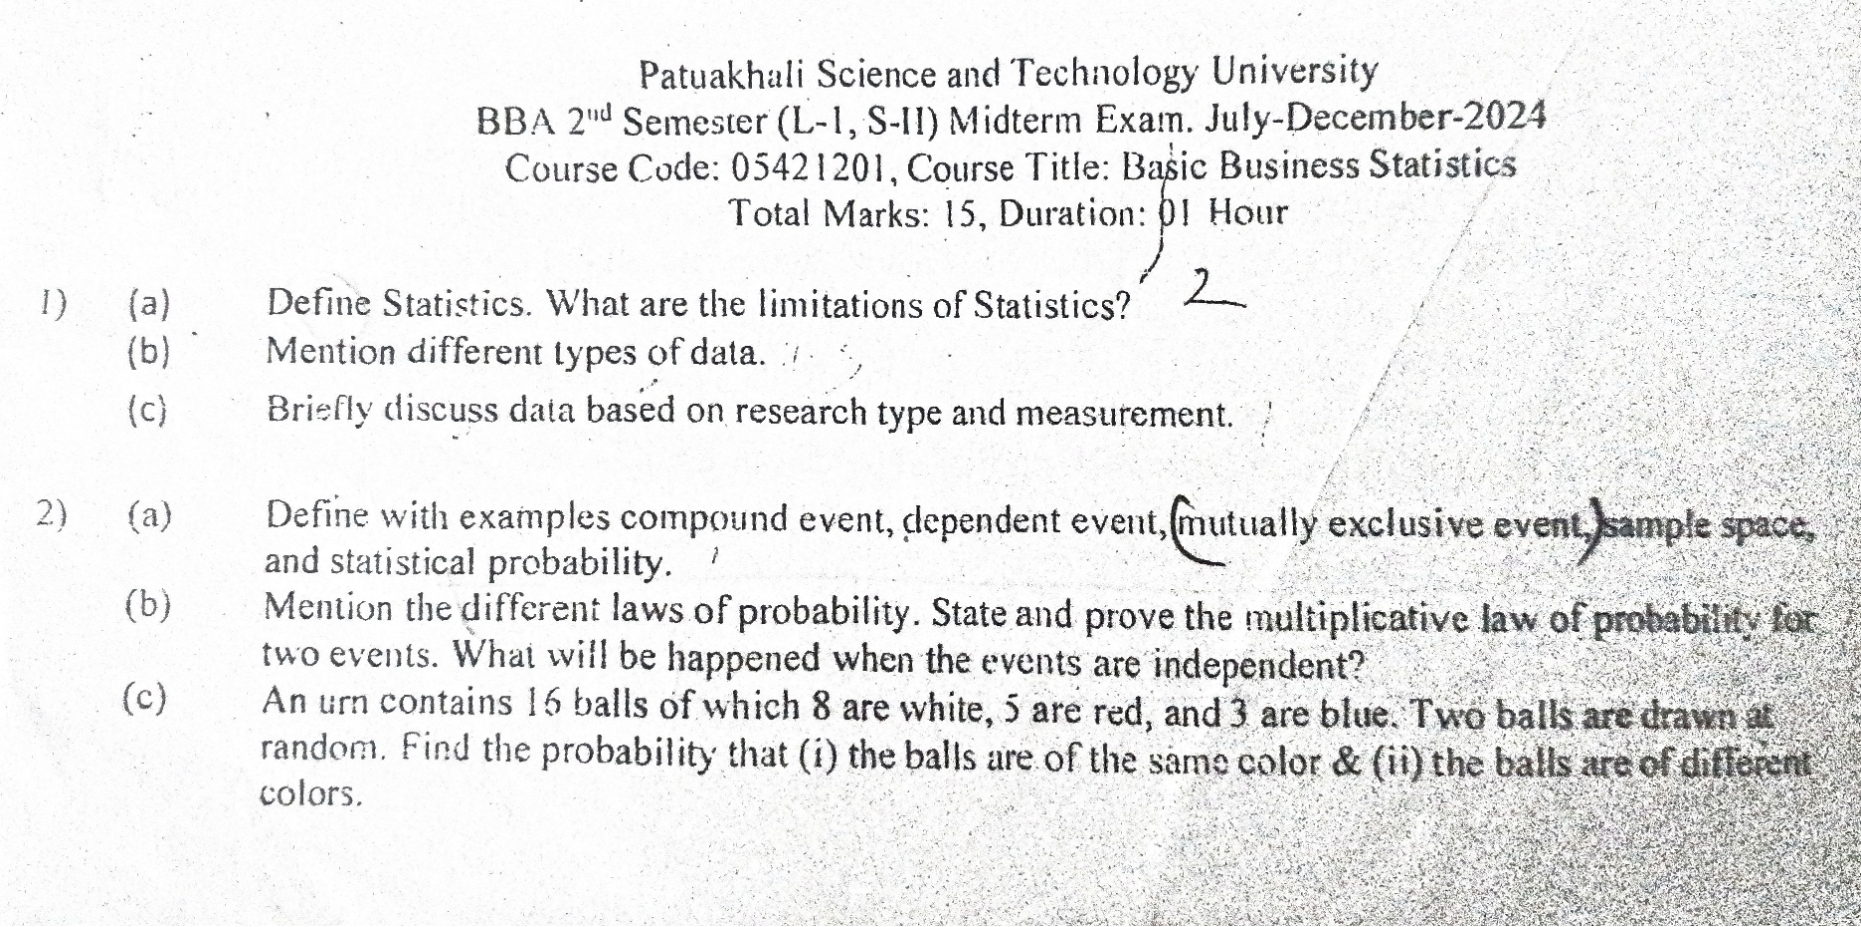
Question 1 (a): Define Statistics. What are the limitations of Statistics?
Definition: According to Fisher (1947), "the science of statistics is essentially a branch of applied mathematics and may be regarded as mathematics applied to observational data." More functionally, it is the scientific method concerned with the collection, organization, presentation, analysis, and drawing of inferences from numerical data.
Limitations:
- Quantitative Focus: It deals with numerical data only. Qualitative attributes must be converted into numbers via ranking or scaling to be analyzed.
- Mass Data Only: It describes aggregates/groups and is not applicable to a single observation.
- Average Truth: Statistical results are true only on an average and in a general sense.
- Probabilistic Error: Conclusions are always subject to a certain amount of error.
- Not a Panacea: It is a tool for drawing conclusions but not a solution for all types of problems.
- Misuse: Statistics can be easily misused to represent data in biased ways.
Question 1 (b): Mention different types of data.
Data is classified based on five primary criteria:
- By Source: Primary and Secondary data.
- By Research Type: Survey and Experimental data.
- By Measurement: Qualitative and Quantitative data.
- By Time: Cross-sectional, Time series, Pooled cross sections, and Panel/Longitudinal data.
- By Scale: Nominal, Ordinal, Interval, and Ratio data.
Question 1 (c): Briefly discuss data based on research type and measurement.
By Research Type:
- Survey Data: Information collected through direct interaction with subjects via interviews, questionnaires, or direct observation.
- Experimental Data: Original information specifically obtained through controlled experiments.
By Measurement:
- Qualitative Data: Data classified based on non-numerical attributes or qualities (e.g., gender, hair color).
- Quantitative Data: Characteristics that can be numerically measured (e.g., height, weight, income, or production figures).
Question 2 (a): Define with examples: compound event, dependent event, mutually exclusive event, sample space, and statistical probability.
- Compound Event: When two or more events occur in connection with each other. Example: If A and B are simple events, their simultaneous occurrence (AB) is a compound event.
- Dependent Event: An event whose occurrence depends on whether another event has occurred in the same sample space. Example: Drawing a card without replacement affects the probability of the next draw, denoted as
. - Mutually Exclusive Event: Events that cannot happen at the same time; the occurrence of one excludes the other. Example: A single coin toss resulting in both Heads and Tails.
- Sample Space: The set of all possible outcomes of an experiment. Example: For a coin toss,
. - Statistical Probability: The limit of the relative frequency (
) as the number of independent trials ( ) approaches infinity. Example: If a coin is tossed 1,000 times and results in 500 heads, the probability is 0.50.
Question 2 (b): Mention the different laws of probability. State and prove the multiplicative law of probability for two events. What will happen when the events are independent?
Laws of Probability: The two laws are the Additive Law and the Multiplicative Law.
Multiplicative Law (Theorem of Compound Probability): The probability of the joint occurrence of two dependent events A and B is the probability of the first event multiplied by the conditional probability of the second. Formula:
Proof:
- Let
be the total number of equally likely outcomes. - Let
be outcomes favorable to event A, and be outcomes favorable to both A and B. - By definition, the probability of A is
. - The conditional probability of B occurring given A has occurred is
. - Multiplying these two gives:
. - Since
is the definition of , the theorem is proved: ** **.
Independent Case: If events are independent,
Question 2 (c): Urn Probability Problem.
Problem: 16 balls (8 White, 5 Red, 3 Blue). Draw 2 balls.
Step 1: Total Outcomes (
Step 2: Solve for (i) Same Color: Favorable outcomes (
- Two White (
): - Two Red (
): - Two Blue (
): Total . **Probability = **
Step 3: Solve for (ii) Different Colors: This is the complement of drawing the same color: **Probability =